Learn the basics of charts and graphs in a few minutes
Description
In this excel tutorial I will show you the quickest and easiest way to summarise your data in a chart and how to incorporate the charts into a Word document for a written report or a PowerPoint presentation
Summary of work sequence.
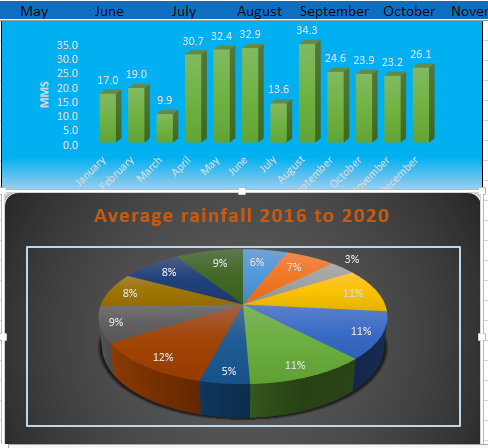
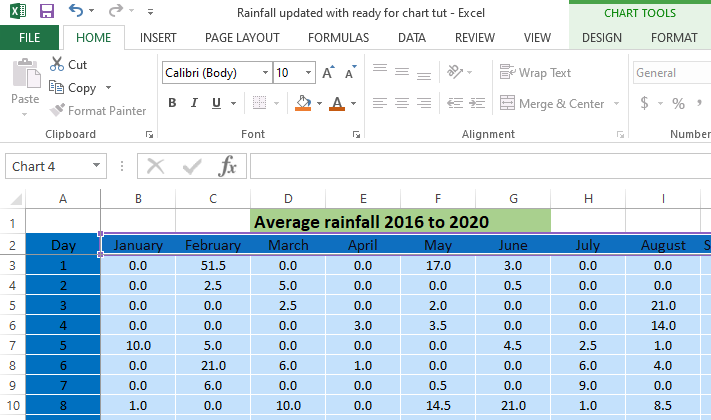
- Select data to be included including headings. This can be tricky for instance this chart contains month totals over five years and month ave over 5 years which is more meaningful. So in this case I want chart to show month and ave for the five years. Now I could also include the annual ave over five years or just stick with the month ave say if I want to know when to plant my wheat.
- If the data is not contiguous the select first row(months) and then CTRL- click and select second row(averages).
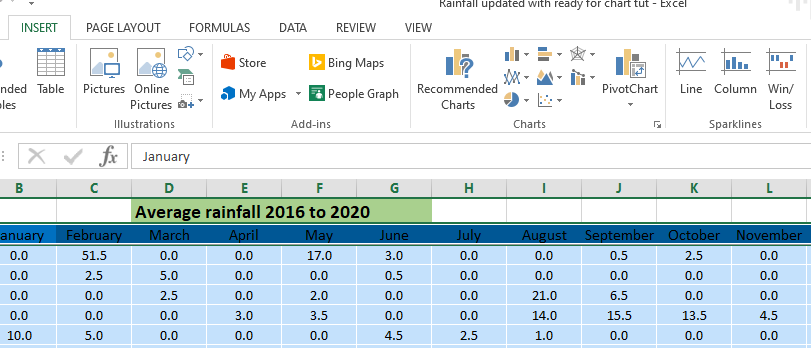
- Now click on the INSERT tab at the top to access chart options.
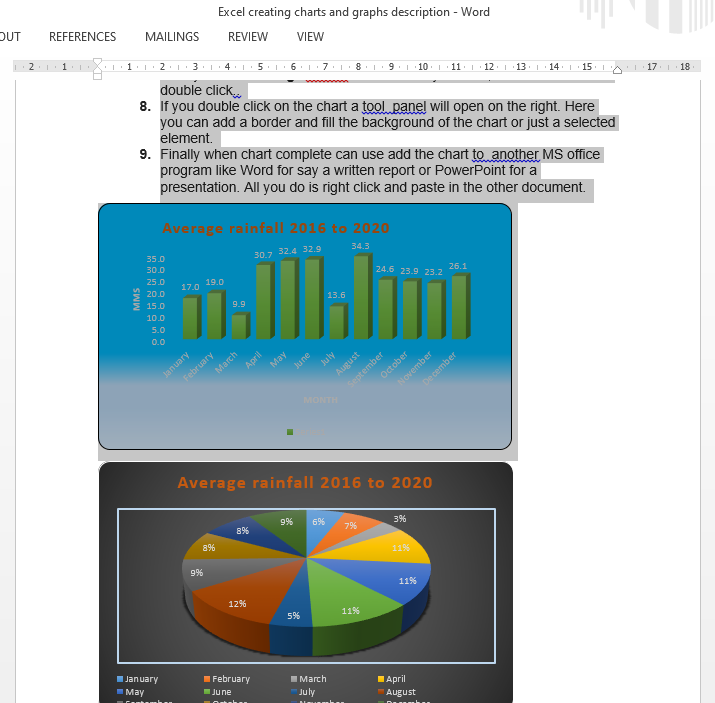
Select chart type from recommended charts either column or pie, don’t worry about style yet.
- Under Chart tools click design tab this will bring up style options , select best options select best option.
- Notice when you hover over an option it will preview on the selected chart.
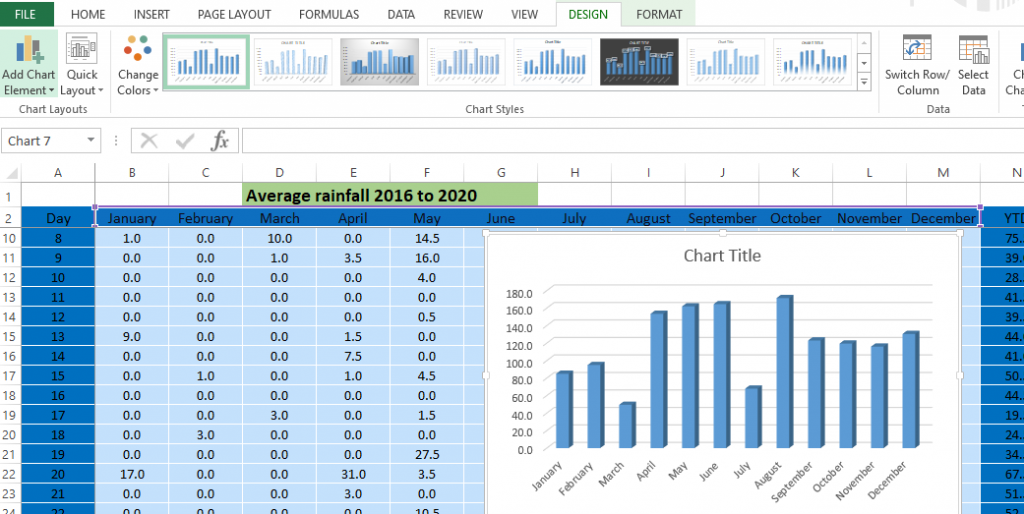
- Click on quick layout choose best option to add further refinement to design.
- Click add chart element to further refine if necessary. Labels can be typed in box provided or to select an already existing title from the spread sheet, highlight the title, right click-copy , highlight title box on chart and press enter.
- Finally click on change colors if that’s what you want, select a colour and double click..
- If you double click on the chart a tool panel will open on the right. Here you can add a border and fill the background of the chart or just a selected element.
- Finally when chart complete can use add the chart to another MS office program like Word for say a written report or PowerPoint for a presentation. All you do is right click and paste in the other document.
Here is a video tutorial on how to create an Excel chart :
Here are some more useful Excel tips and tricks:
Comments are most welcome, try this and send us some feedback☺️ Why not visit our YouTube channel and browse through our other videos? http://www.youtube.com/c/AnnErasmus
Short Disclaimer/disclosure: My videos/articles are for informational and educational purposes only, you should consult with a professional before attempting anything seen or done in my videos/articles. Please read full disclaimer here: https://basiclowdown.com/disclaimer-disclosure-page/